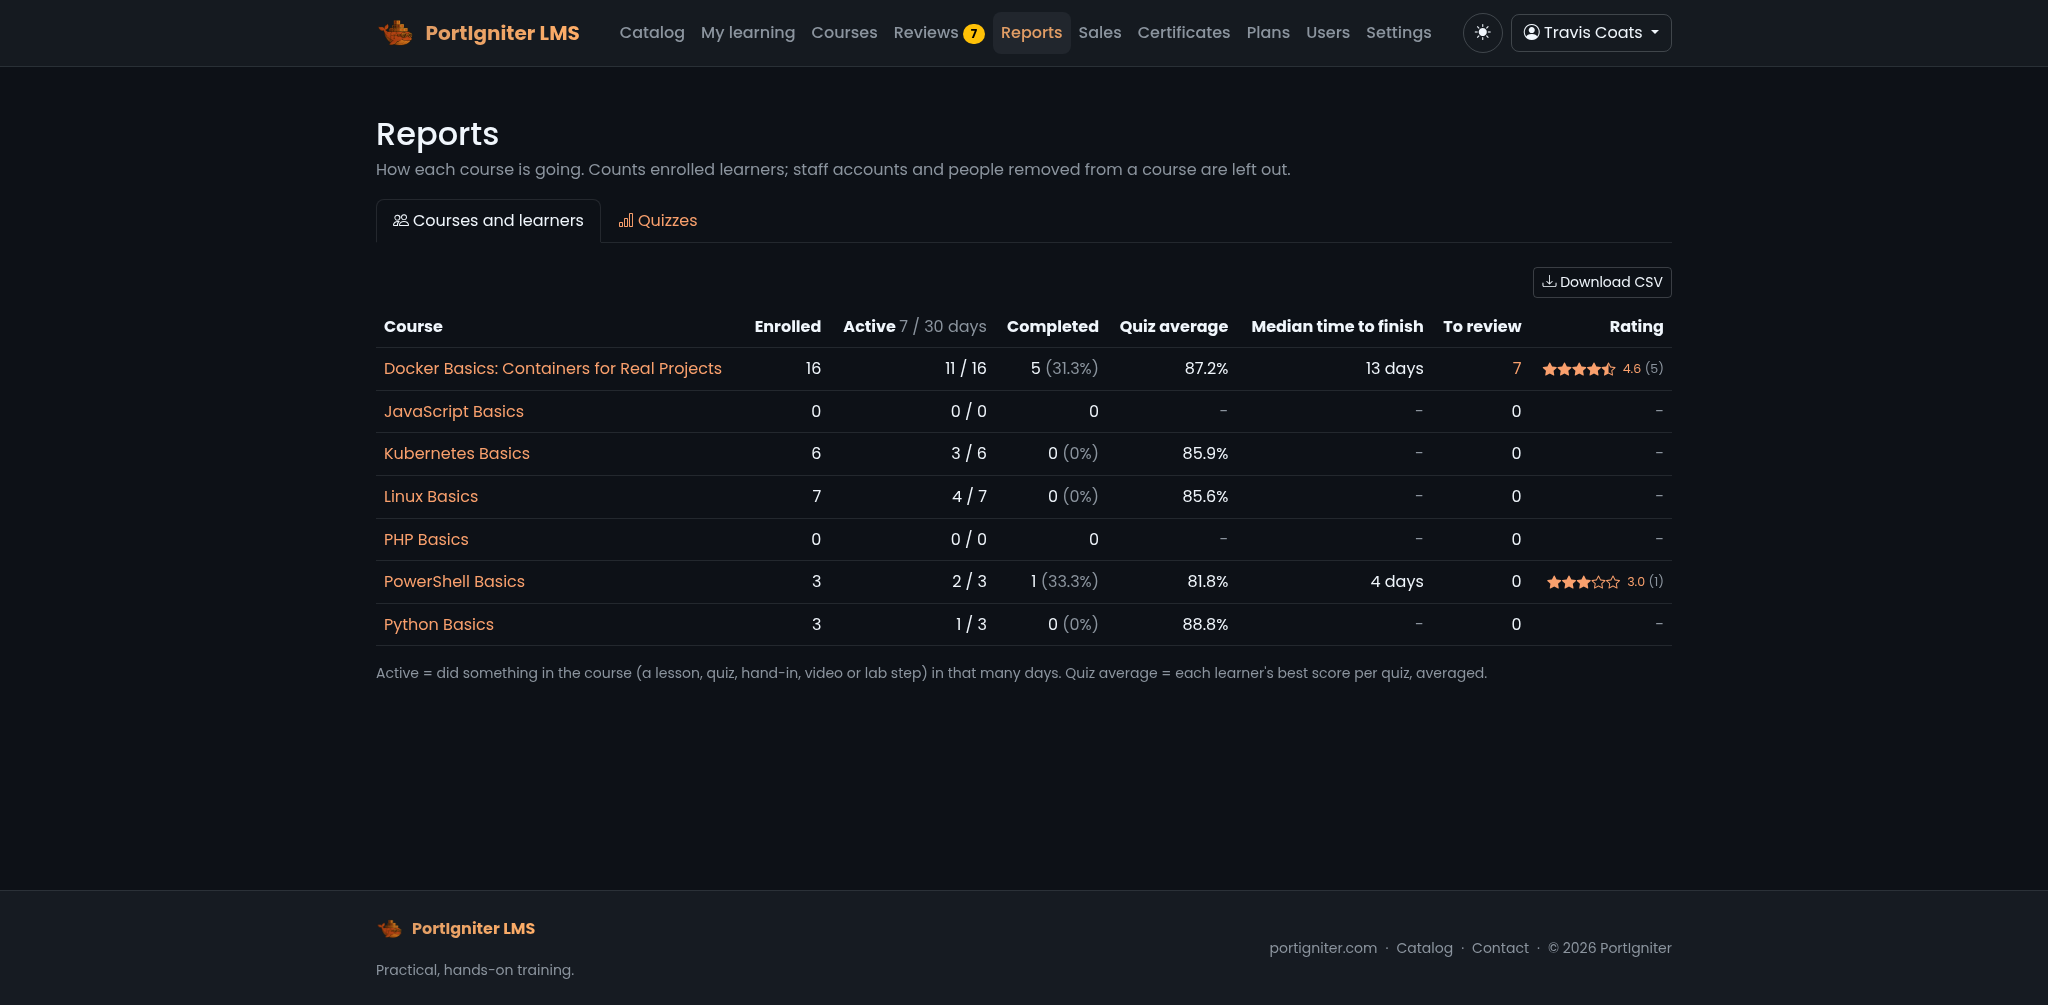
Open Reports in the header. It has two tabs: Courses and learners, and Quizzes. Administrators and instructors can see reports for every course. Staff accounts are left out of all figures, so testing your own course never skews the numbers.
Course overview
The Courses and learners tab lists every course with:
| Column | Meaning |
|---|---|
| Enrolled | Learners in the course. |
| Active | Learners active in the last 7 and 30 days. |
| Completed | The completion rate. |
| Quiz average | The average of each learner’s best score on each quiz. |
| Median time to finish | How many days learners typically take to complete the course. |
| To review | Hand-ins and essays waiting in the Reviews queue. |
| Rating | The average learner rating. |
Click Download CSV to export it.
Course roster
Click a course to see everyone enrolled, with their status, progress through required items, quiz average, and last activity. Filter by name, email, or status, sort the list, and click Download CSV to export what you see.
Learners with no activity for 14 days are marked inactive, so you can see at a glance who might need a nudge.
Learner detail
Click a learner to see every item in the course by module: what they finished and when, their quiz attempts, their assignment hand-ins, and how much of each video they watched. This page also holds the access actions described in Enrollment & Access.
Quiz analytics
The Quizzes tab lists every published quiz. You can also open a quiz’s analytics with the Stats button in the quiz builder.
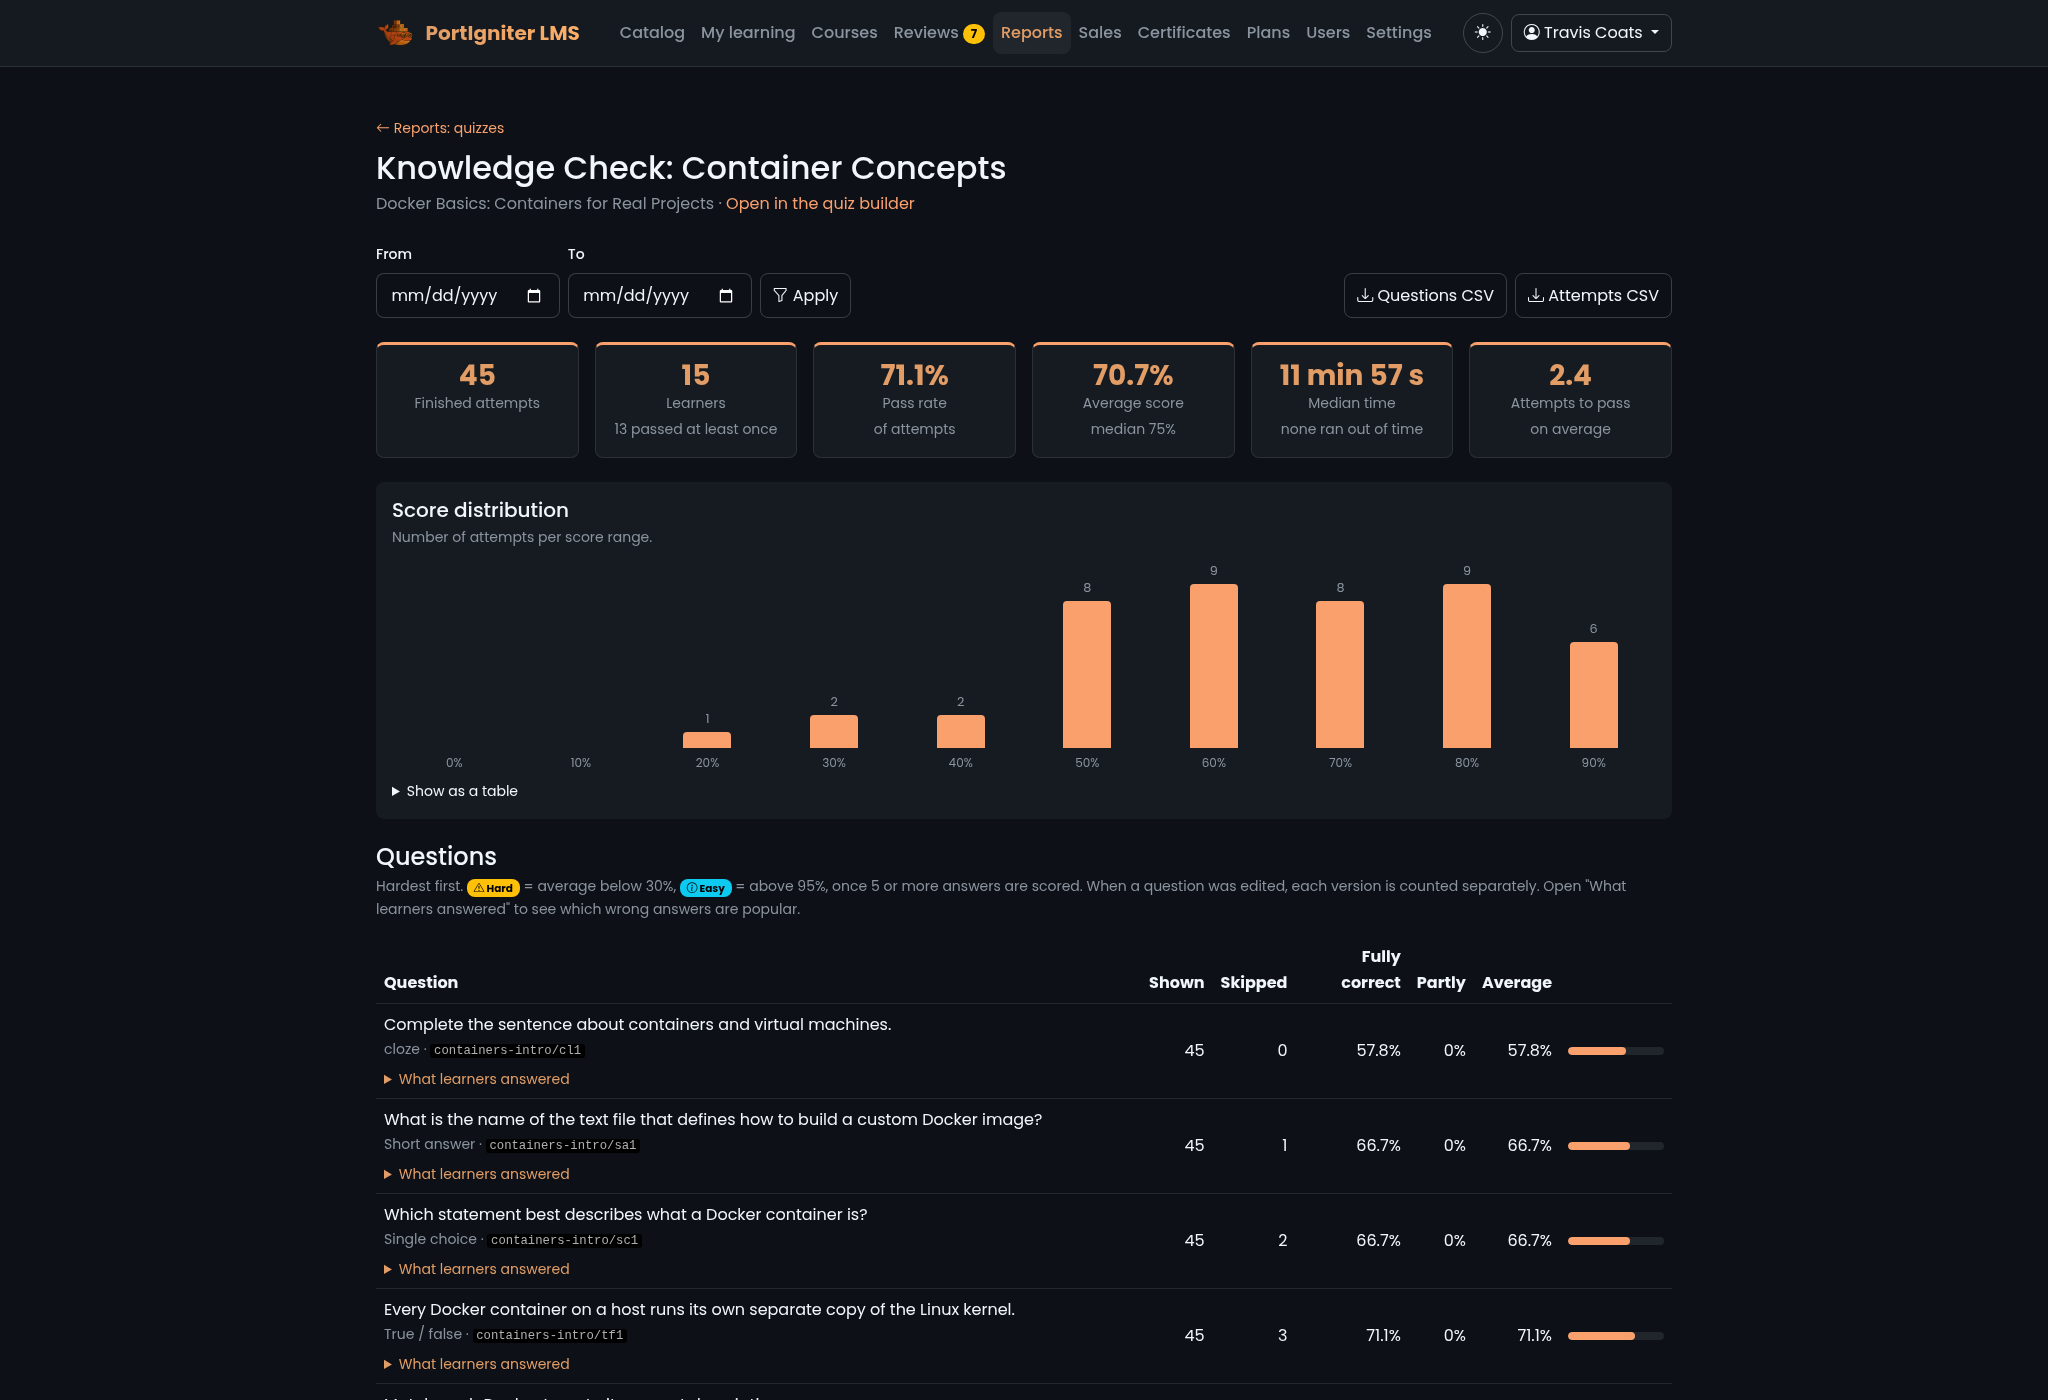
For each quiz, you get:
- Attempts, learners, and pass rate, along with the average and median score, the median time taken, timeouts, and how many attempts learners need to pass.
- A score histogram, with a table view.
- Per-question results: how often each question was shown, skipped, fully correct, and partly correct.
- What learners answered: how often each option was chosen, the most common typed answers, and results for each blank, pair, or item. This is the quickest way to find a misleading distractor.
- Flags for questions that look too easy (over 95% correct) or too hard (under 30% correct), once there are enough answers to judge.
If you edit a question after learners have answered it, its results are split by version, so old and new wordings are never mixed together.
Narrow the results to a date range, and download the questions or the attempts as CSV.
Ratings and feedback
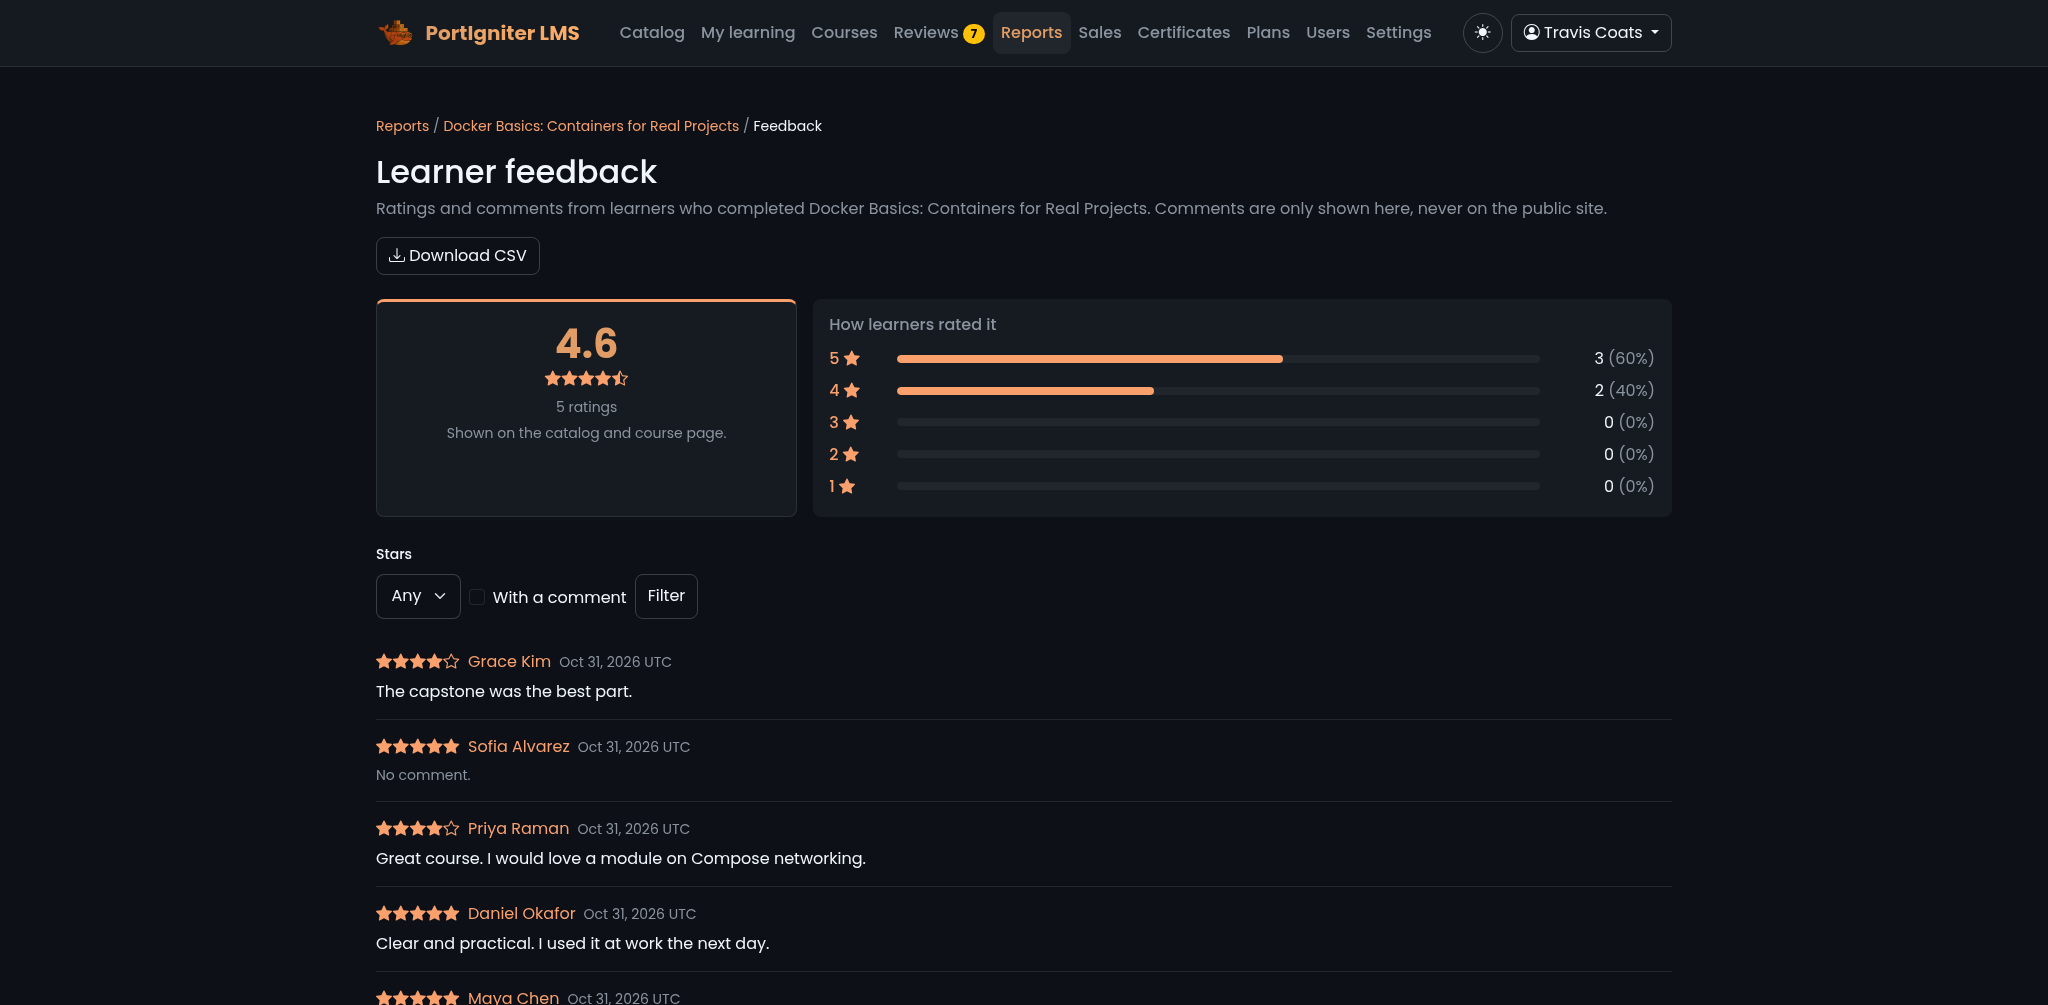
Learners who complete a course are invited, at the top of the course page, to rate it from 1 to 5 stars and leave an optional comment. They can change their rating later.
- The average rating is public. Once a course has 3 or more ratings, its stars appear on the catalog card and the course page.
- Comments are private. Only staff can read them, under Reports, then the course, then Learner feedback. The page shows the average, the spread of ratings, and every comment with a link to that learner’s report. Filter by stars, and download it as CSV.